 FCT digital services
The indicators are generated from public curriculum data CIÊNCIAVITAE reports are published by all those who have a current professional or educational relationship with the subscribing institution. The quality of the indicators depends directly on the completeness of the data recorded on the platform. CIÊNCIAVITAE.
Service
Institutional Indicators
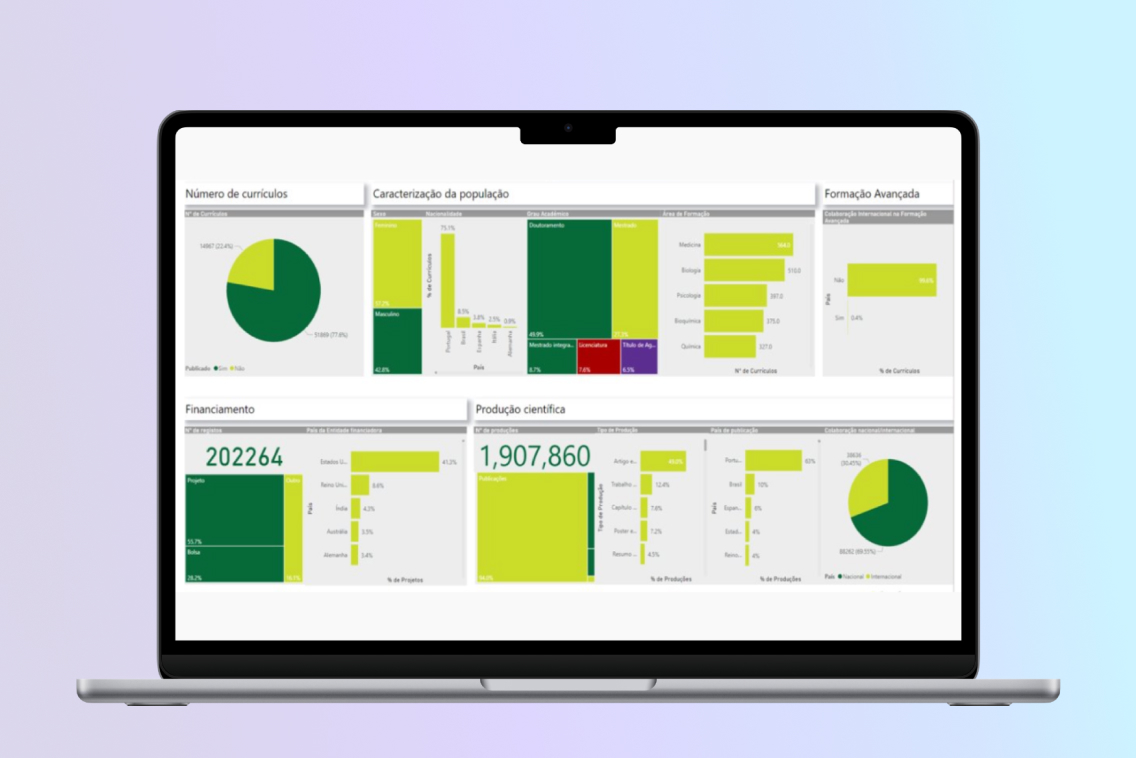
The Institutional Indicators service provides institutions with indicators for a broad understanding of their community, supporting decision-making and promoting greater transparency in the management of internal processes.

67
Subscribing entities
107
Users
192
Service requests
What is it
Research and Development Institutions and their Indicators
The Institutional Indicators service aims to support R&D institutions in generating relevant indicators, based on the information deposited in the CIÊNCIAVITAE by its academic and scientific communities. The development of this service benefited from an iterative review process focused on data quality and the usability of the indicator dashboards, in collaboration with R&D institutions.
HOW IT WORKS
Institutional Indicators: Functioning and Access
The service provides relevant indicators generated based on the curricular data deposited in the CIÊNCIAVITAE and assists national R&D institutions in monitoring their activities.
Generation of indicators
The indicators are generated from public curriculum data CIÊNCIAVITAE reports are published by all those who have a current professional or educational relationship with the subscribing institution. The quality of the indicators depends directly on the completeness of the data recorded on the platform. CIÊNCIAVITAE.
Access
After subscribing, the institution's representative will receive an invitation to access the indicators panel on the platform. CIÊNCIAVITAE, accessible via federated authentication with CIÊNCIA ID. To activate access, simply accept the invitation by following the steps below. instructions.
After activation, the representative will also be able to manage the accesses of other members of the institution, as explained here.
The service has a hierarchical structure, allowing a main institution (e.g. University) to view the indicators of its organic units (e.g. Colleges).”
Availability and update format
The dashboard is available through the Power BI tool. The service also provides an Excel file containing the raw data used to generate the indicators displayed on the institution's dashboard. This file is sent to the email address associated with the subscription.
The information provided is updated monthly.
Subscription
Subscription to this service must be requested through a request sent to the address helpdesk@cienciavitae.pt, carried out by the institution's top representative or someone mandated by him/her. In this case, the email address of the institution's representative(s) must be included as a copy.
It is necessary to indicate a contact person with the following details:
• Name
• ID SCIENCE
• Email address associated with CIÊNCIA ID.
This contact will serve as an intermediary between the team CIÊNCIAVITAE and the institution, assuming the role of manager of access to the dashboard with institutional data.
After verifying the data provided, the process of creating the user data cube can begin. CIÊNCIAVITAE affiliated with the institution.
For more information about the service and how to use it, see the Subscriber's Guide – Institutional Indicators or contact us.
Who is it for?
Target Audiences
TESTIMONIALS
-
Through this service, we can gain a clear understanding of the legacy and productivity of our unit's researchers, facilitating the ongoing assessment of their impact and progress.

Science and Technology Manager
-
The Institutional Indicators Service provides a comprehensive overview of our institution's research and teaching activities. It allows for comprehensive monitoring of scientific output and the performance of faculty and researchers.
Senior Technician – Quality Promotion Division
Subscribers
Frequently Asked Questions
The Institutional Indicators service is based on information deposited by users in the CIÊNCIAVITAE, namely data on scientific production, participation in research projects, activities, distinctions, among others.
The indicators provided correspond to the most relevant metrics in the academic-scientific system, according to a survey by approximately 20 R&D institutions involved in the pilot project that preceded the service's launch. These indicators include, for example, the academic qualifications of employees, the academia-to-industry conversion rate, the number of funding grants, the number and type of scientific productions, the type of collaboration, and the number of awards.
The indicators are presented in dashboards accessible through the Power BI platform. Additionally, an Excel file with the raw data is sent monthly to the email address of the institution subscribing to the service.
The service offers detailed documentation on how to interpret the indicators. In addition, the PTCRIS It provides technical support to assist institutions subscribing to the service in resolving problems or clarifying doubts.
No, the service is provided free of charge to subscribing institutions.
No, the data update and curation service of PTCRIS It is available to all research and development institutions that wish to keep their data up-to-date and accurate in the ISNI+ system.
Institutional Indicators